A Debugging Horror Story: Fixing a Tricky GHC Bug
I recently spent more than 90 hours debugging what ended up being a problem in GHC's base libraries. I'll explain the bug and the context in which I encountered it, then relate some lessons that would've let me solve it in less than ninety hours.
The bug itself
In December 2015, I decided to set up a CI build for Idris. I didn't know what I was getting into. Using Stack seemed like the easiest and best option. After wrestling with problems unrelated to this post for a while, I got it sort of working. Problem was, sometimes it wouldn't finish in under an hour and AppVeyor would abort the build. I futzed around for a while trying to get it to build faster, but eventually realized it was hanging while downloading the dependencies. Stack interleaves downloading and building, so this isn't obvious.
Skipping ahead a bit, it turns out the problem occurs on unreliable networks
when a call to recv or send fails. I'm baffled as to how AppVeyor's virtual
machines in a Google datacenter can have worse internet than my bedroom, but
there it is. If you know, leave a comment, seriously.
On POSIX systems and on Windows' clone of the BSD socket API, send and recv
return the number of bytes sent or received, or -1 if there's an error. There's
an important difference though. POSIX's return type is ssize_t and Windows' is
int. On 32 bit systems, those are both 32 bit signed integers, but on 64 bit
ssize_t is 64 bits and int is still 32. When one of the calls returned -1,
it was interpreted as 4,294,967,295 a.k.a. 0xFFFFFFFF. Since the result wasn't
-1, the library thought the call succeeded and didn't throw an exception. The
"length" gets converted back to an int (actually a Haskell CInt). In recv
you have a buffer with -1 bytes in it. Printf debugging:
blockingReadRawBufferPtr
throwErrnoIfRetry GHC.IO.FD.fdRead
pred res == False
throwErrnoIfMinus1Retry' res = 4294967295
blockingReadRawBufferPtr res = -1
after: buf8096(0--1)
The "-1 bytes" are eventually memcpyd and it segfaults. In sends it thinks
it sent -1 bytes and loops forever, hence the hang.
You can check out my patch for GHC here. It was merged May 19 2016.
Finding it
I wasted a lot of time. There are two broad lessons I learned. First, if you have two hypotheses and one is much easier to characterize and fix, investigate it first, even if you think it's less likely. Second, use the techniques that get you the most useful information for the least effort.
Not actually a race condition
An intermittent failure says "race condition" to me, so I spent a ton of time
investigating that idea. I found the code that manages parallel downloads and
added a bunch of debug logging
(search for parMapM_). I cloned it into a separate project and ran it
overnight trying to get it to hang. It didn't, obviously.
If the problem wasn't in parMapM_, it must be in GHC's RTS, right? (No.) I
looked over the source for bad spinlocks and tried building Stack with the
debugging RTS. The spinlocks are only used during GC and debug logging showed
the hang didn't ever happen during a collection.
In retrospect, there are more sources of nondeterminism than concurrency. The outside world can and in this case did cause an intermittent failure. I spent lots of time investigating the presumed race and almost no time proving that a race was actually the problem. There are several knobs one can twiddle to try and show that the problem is a race. Stack has a setting for the number of parallel downloads. You can turn the threaded RTS on and off and set the number of OS threads it uses. I encountered a bit of a red herring here. The problem isn't in the threaded RTS but it only happens when the threaded RTS is in use.
Because of the way GHC deals with nonblocking IO on Windows, the code for reading and writing to file descriptors and sockets checks whether it's running in the threaded RTS. The code for the non threaded RTS doesn't exhibit the bug.
When I decided to check whether it was related to networking, I got positive results almost immediately. There's a tool called Clumsy that simulates a variety of network failures. Setting it to drop packets got the bug to reproduce much more consistently on my local machine. (Trying to debug something like this on a remote system you don't control is awful.) Setting it to corrupt them got it to crash around 50% of the time. I was very happy.
I got a working testcase using only the library Stack uses for HTTP -
http-conduit - on the first try. I
reported it to the
maintainer, Micheal Snoyman. He had a decent suggestion but was ultimately not
helpful. This is no fault of his own, it's a Windows only bug that I couldn't
reproduce in isolation and at the time thought had to do with TLS.
High leverage and low leverage techniques
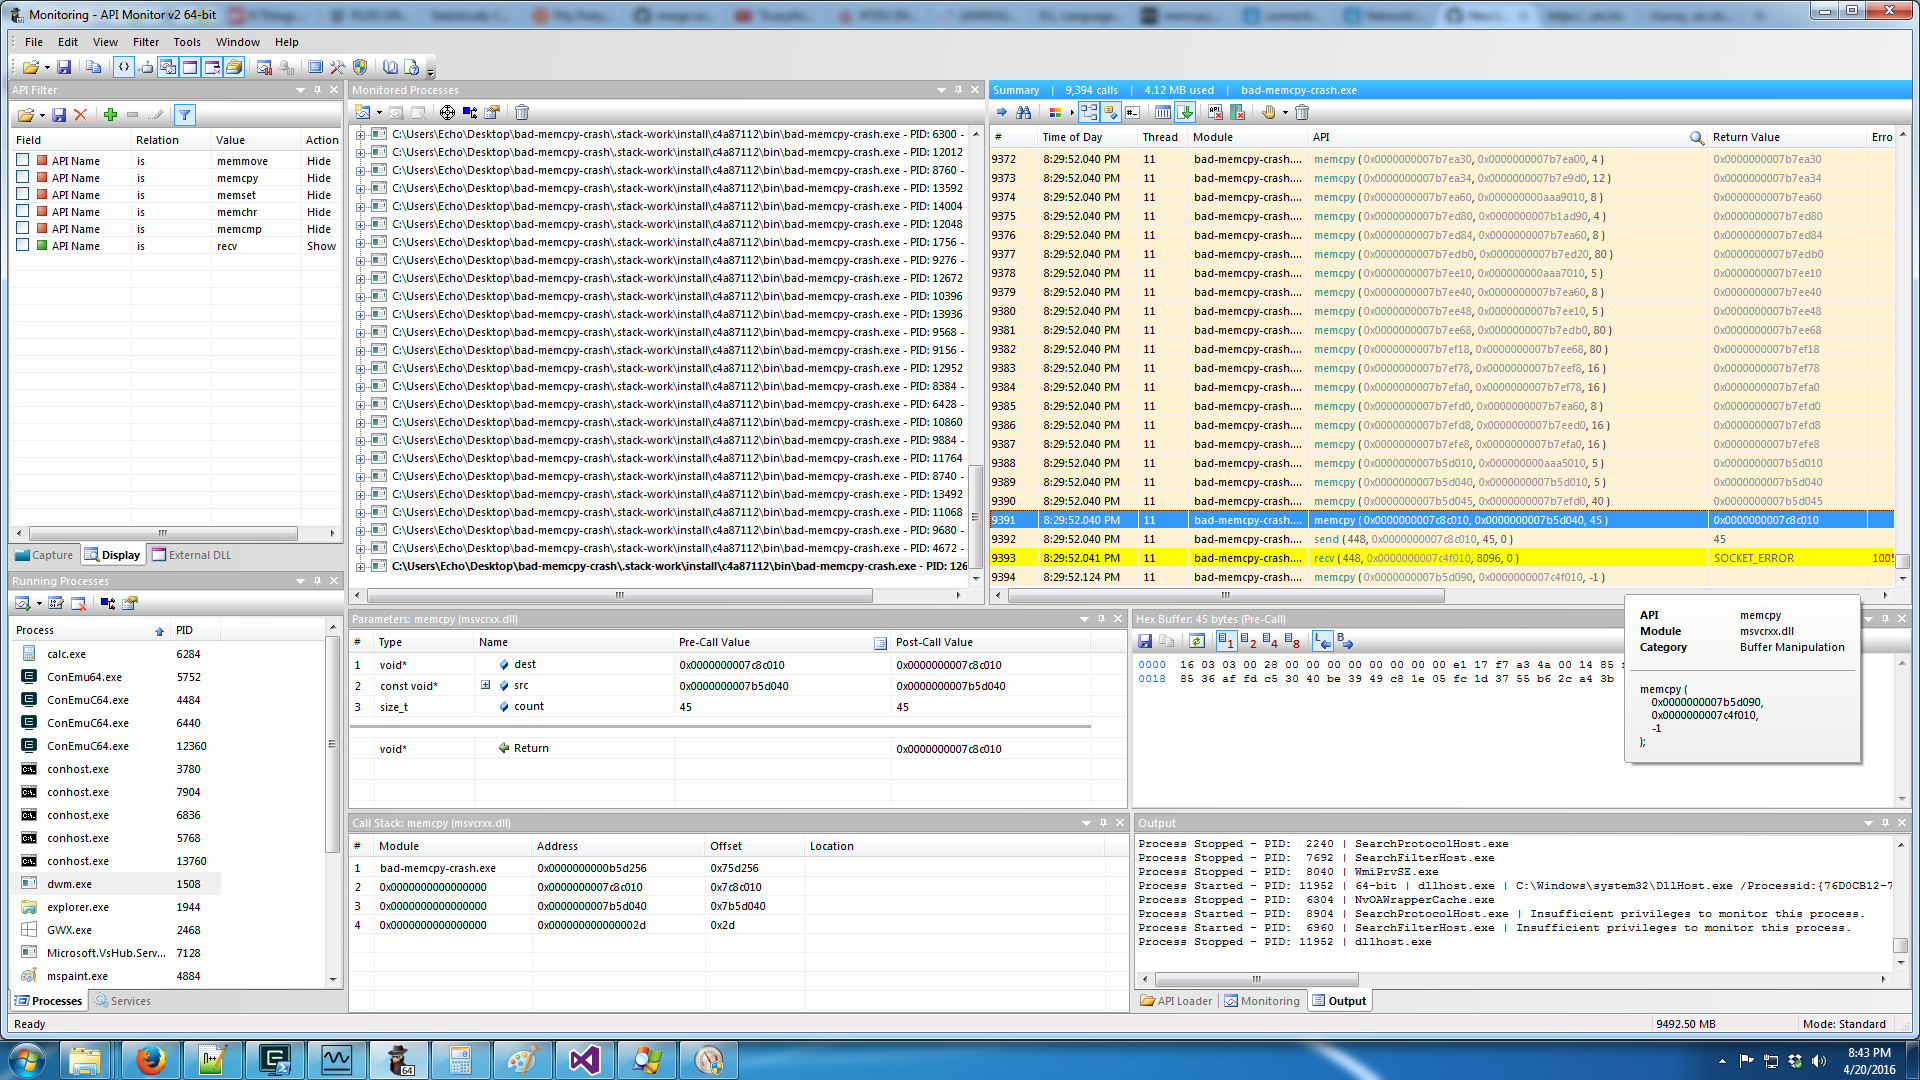
The most time-efficient tools were Clumsy and
API Monitor. API Monitor lets you see every call
to any Windows DLL. It clearly showed the failing call
to recv followed by a memcpy with length -1 as well as repeated failing
calls to send. It's like a sort of super-strace in that it intercepts calls
before a syscall is even issued. This is important since a lot of things that
are syscalls on Linux are implemented in DLLs on Windows.
I also used hpc-strobe, a very cool and underappreciated tool. At regular intervals, it records a program coverage report. The trick is that these reports include counts of the number of times each expression was entered, not just booleans. You can take two reports, subtract one from the other and find out what code was executed in between the times it recorded them.
This was supposed to tell me what code it was hanging in. Unfortunately there's
a caveat I didn't realize at the time: library code isn't instrumented at all.
Once it reported the hang happened while the socket handle was being evaluated,
once while the hash of the download was being computed and once while parMapM_
was running. All of that was just coincidence: the hang wasn't in any of the
code that hpc-strobe can see. I did a lot of printf debugging trying to find the
hang in places it wasn't.
I still think it's really cool, but knowing its limits is important.
I did a lot of printf debugging in the course of tracking down the bug. It was indispensable, but also tedious and error prone. An interactive debugger would've been great, but doesn't really exist. GHCi's debugger is better than nothing, but irrelevant in this case - it's too different from how the program actually runs. In particular, it can't use the threaded RTS so the bug doesn't show up at all. You can load Haskell executables in GDB, but there aren't any symbols in Haskell code and no backtraces either. There is preliminary work to improve the situation but it's immature and as far as I can tell doesn't work at all on Windows.
Conclusion
To save yourself tons of debugging time: question your assumptions and use powerful tools but know their limits. Printf debugging is useful but should only be used after you've exhausted the more efficient options.
Finally, I'm looking for programming work. If you or your company is looking for someone, particularly if the work involves programming language design and implementation, get in touch. It needs to be in Portland, remote, or cool enough that I'd want to move. My resume is here.
comments powered by Disqus